


The ITC Consult team has developed a standardized Power BI template for analyzing e-commerce sales performance and advertising costs. The solution provides a comprehensive view of online business performance by consolidating orders, revenue, cost of goods sold (COGS), advertising expenses and profit into a single interactive report.
Designed for online retailers and businesses selling through their own e-commerce platforms, marketplaces, or multiple sales channels, the template helps organizations understand the relationship between sales performance, operational costs and marketing investments through intuitive dashboards and actionable analytics.
Executive Dashboard
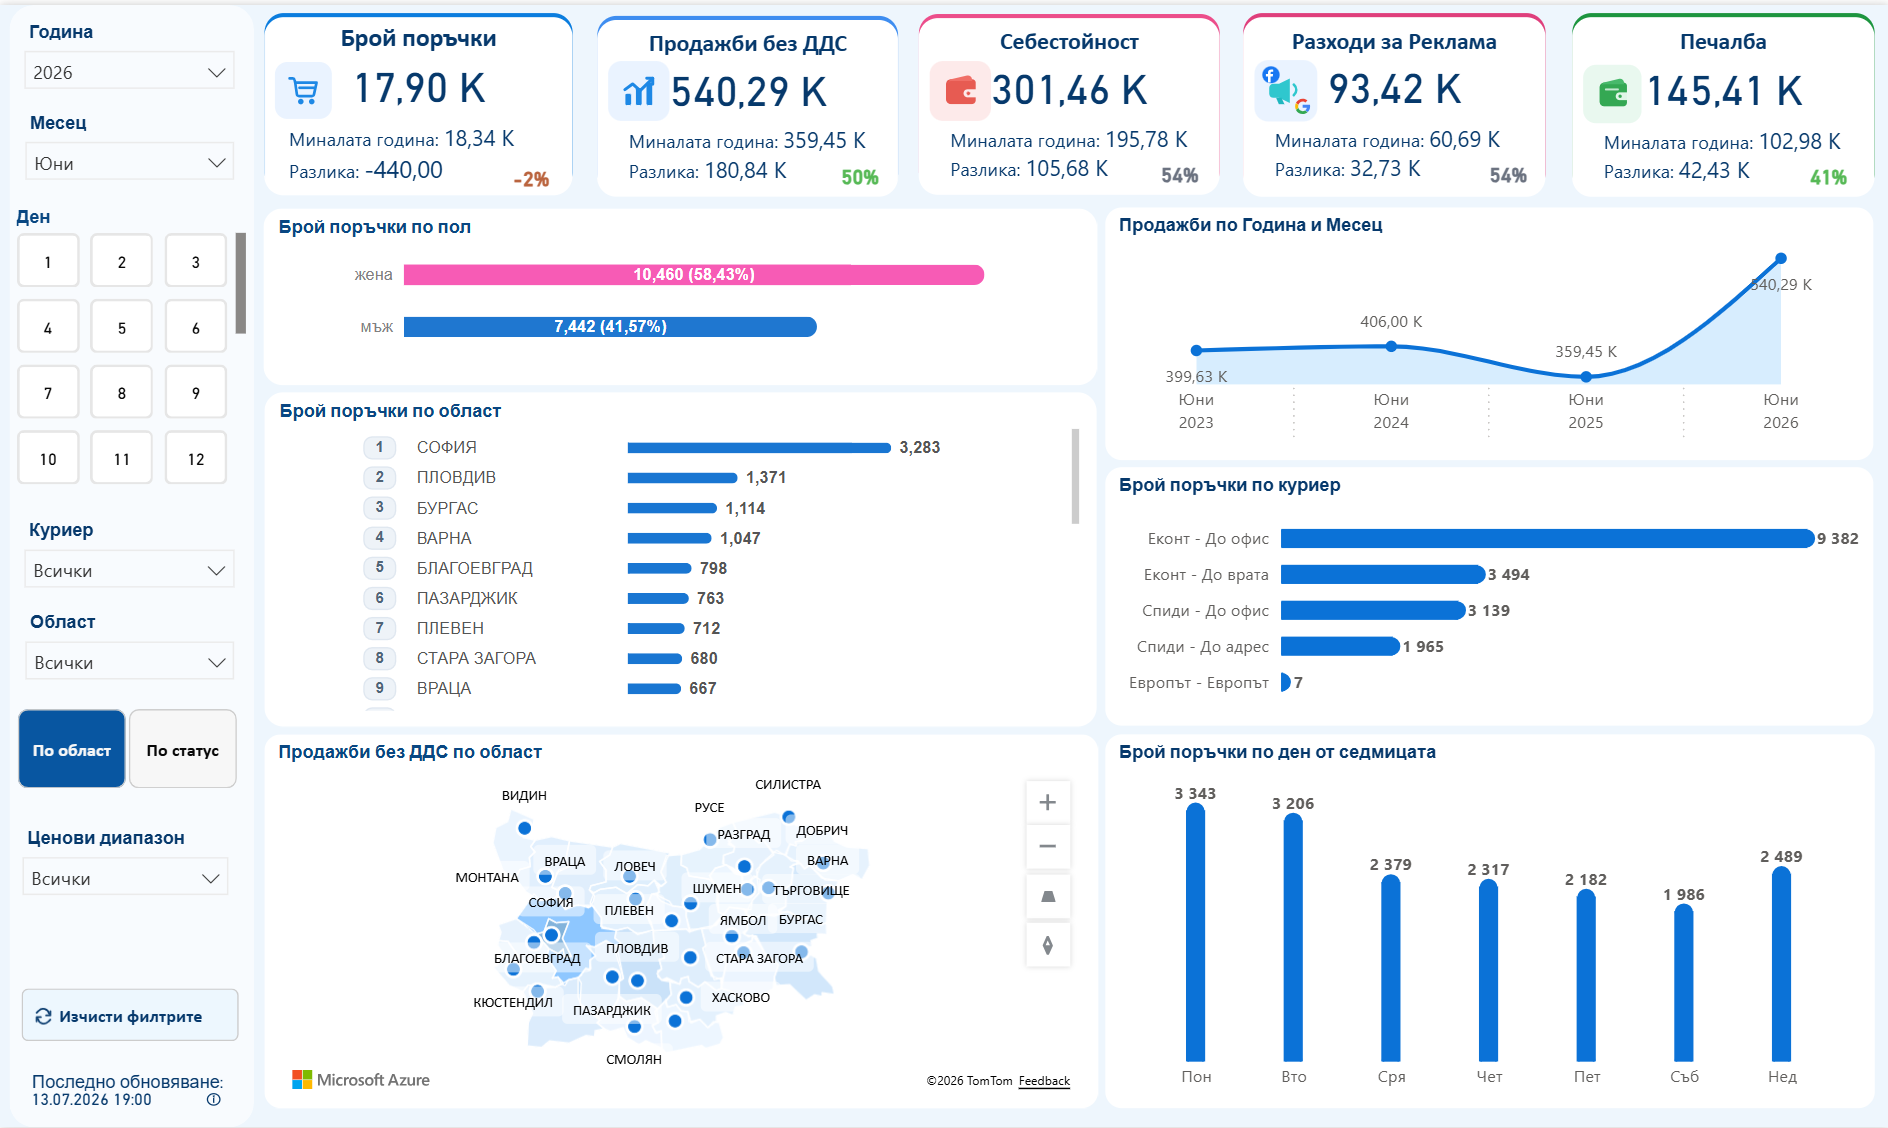
The Executive Dashboard serves as a centralized management view for monitoring daily e-commerce performance. Key business metrics including total orders, net sales (excluding VAT), cost of goods sold, advertising expenses and profit, are presented alongside year-over-year comparisons, enabling decision-makers to quickly determine whether revenue growth is translating into improved profitability.
Interactive breakdowns by customer gender, region, courier and day of the week provide valuable insights for campaign planning, logistics optimization and promotional activities. Dynamic filters allow users to drill down from a high-level overview to specific time periods, geographic regions or price ranges, making it easier to identify trends and detect performance issues as they emerge.
Order Status and Price Range Analysis
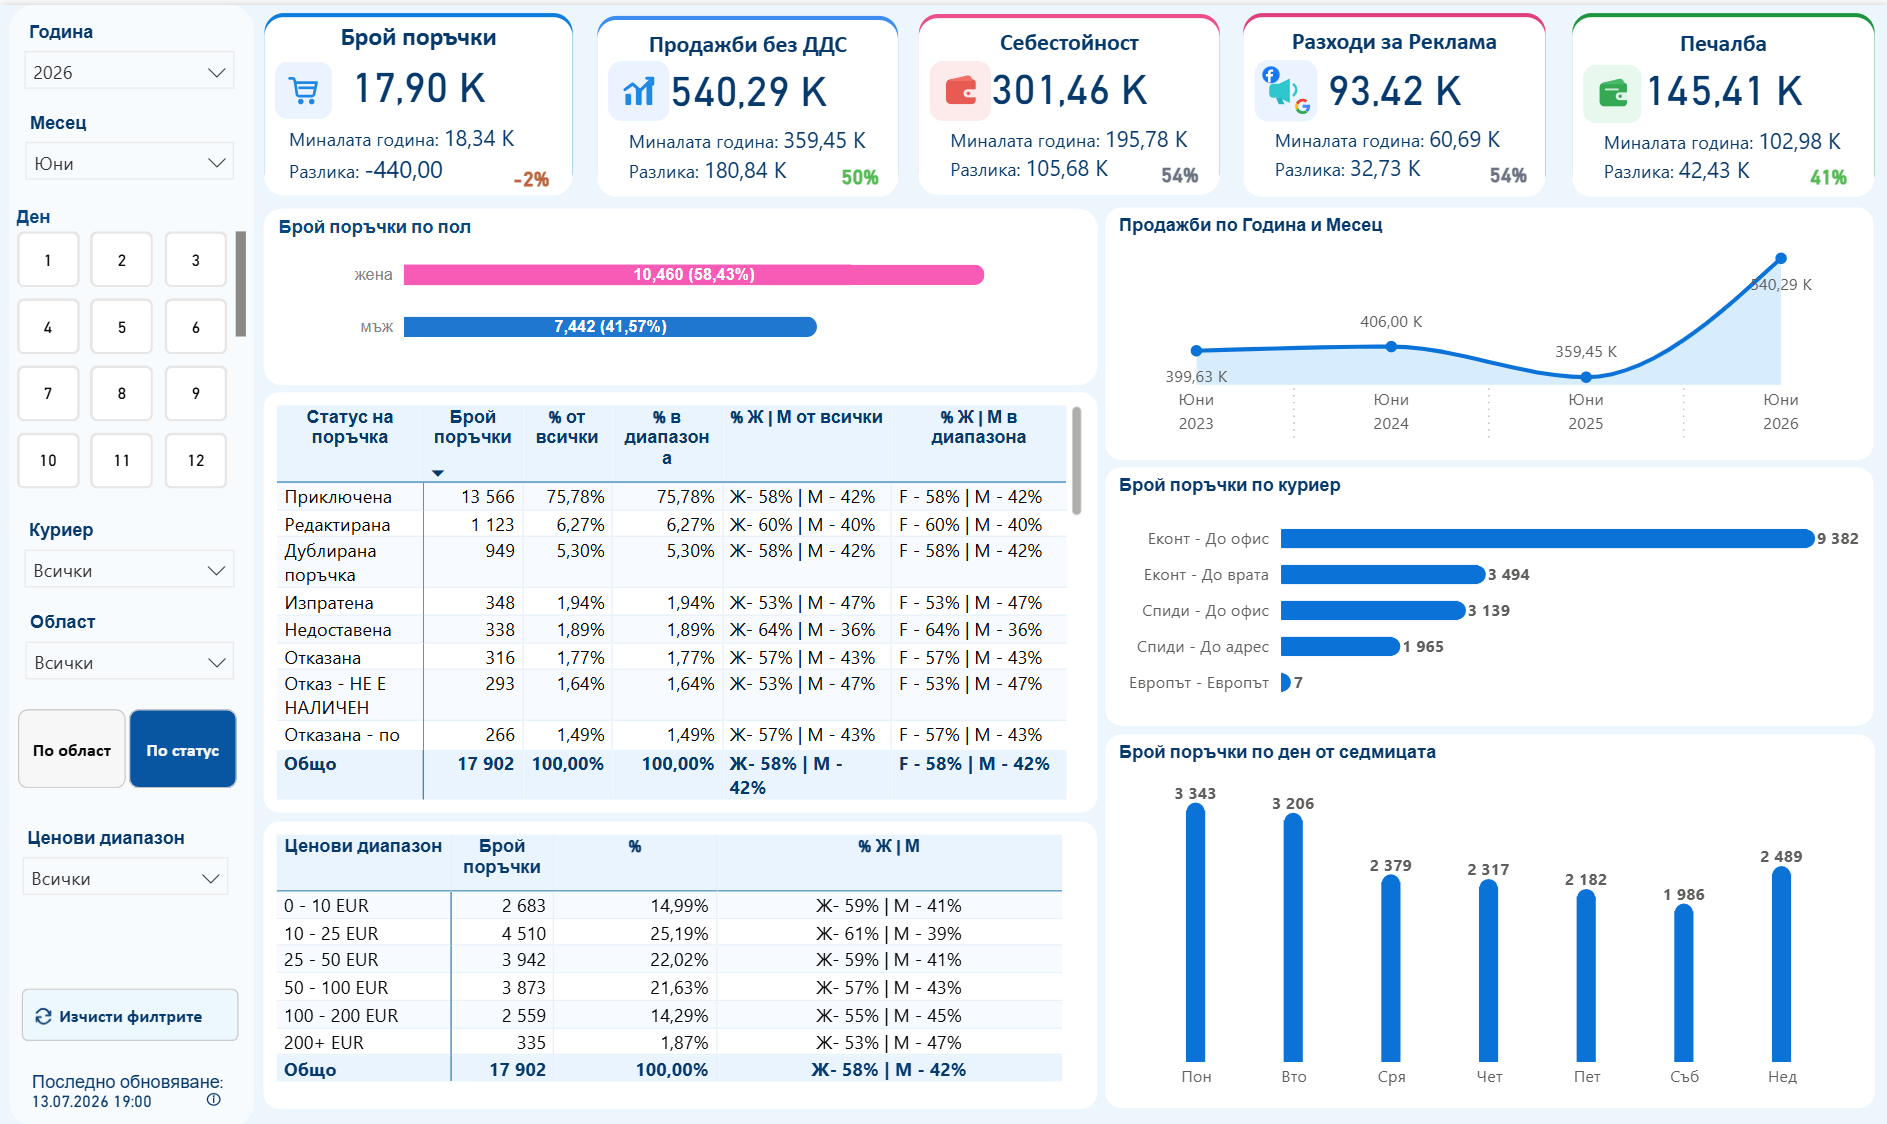
This dashboard extends the executive overview with detailed operational insights into the order fulfillment process. It displays the number and percentage of completed, edited, duplicated, shipped, undelivered and cancelled orders, together with customer gender distribution for each status.
These insights help organizations monitor fulfillment success rates, identify cancellation trends and pinpoint operational bottlenecks throughout the order lifecycle.
The price range analysis reveals where customer purchases are concentrated across different order values and how purchasing behavior changes between customer segments. This information supports decisions such as defining free shipping thresholds, creating bundled offers, optimizing promotional campaigns, refining product assortment and increasing average order value (AOV). Together, these analyses help reduce cancellations while improving operational efficiency.
Product Performance and Advertising Analysis
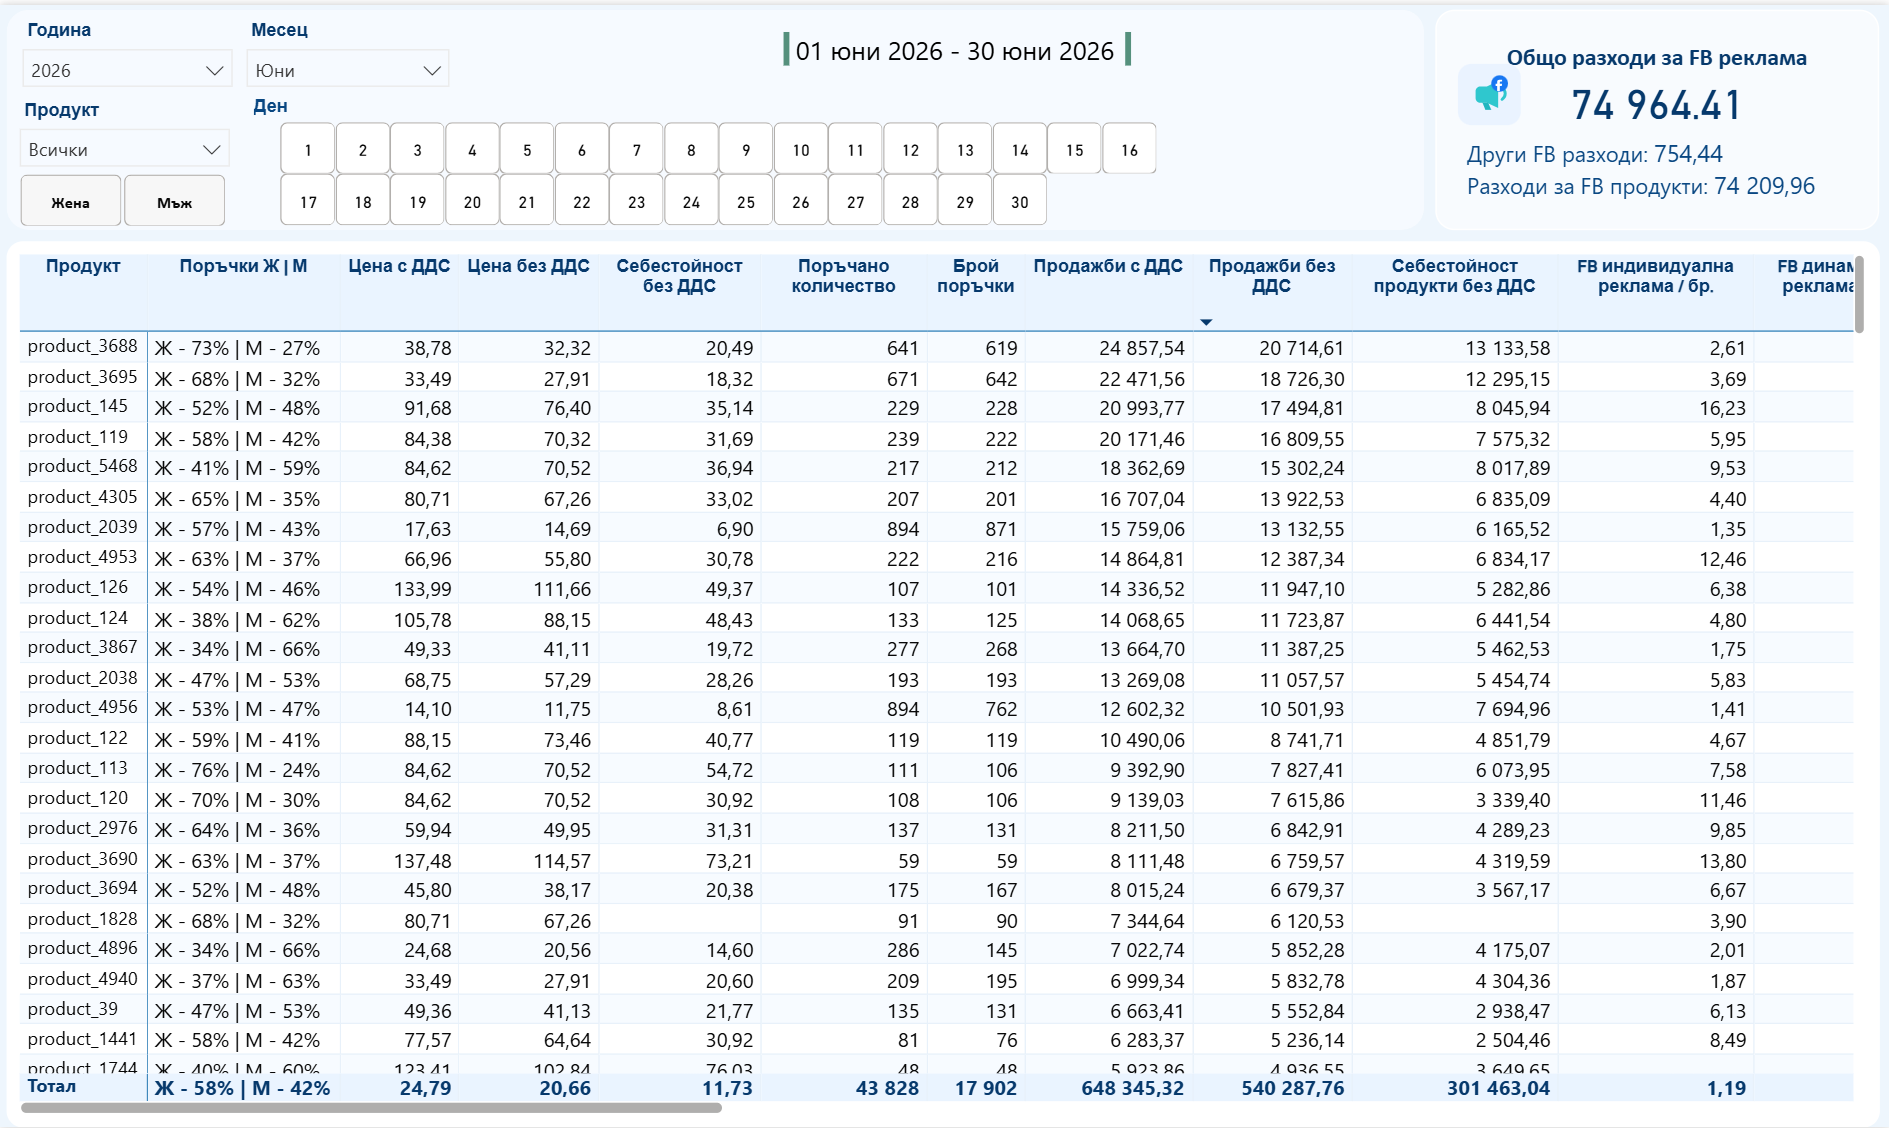
This dashboard connects sales and marketing performance at the individual product level. By combining order volume, pricing (including and excluding VAT), cost of goods sold, revenue and allocated advertising costs, businesses gain a clear understanding of the true profitability of each product, not just its sales volume.
The analysis makes it easy to identify products generating high advertising costs with low returns, as well as high-performing products that deserve additional marketing investment. Marketing teams can use these insights to reallocate budgets, discontinue underperforming campaigns and prioritize products with stronger margins and higher return on advertising spend (ROAS).
Inventory Performance Dashboard
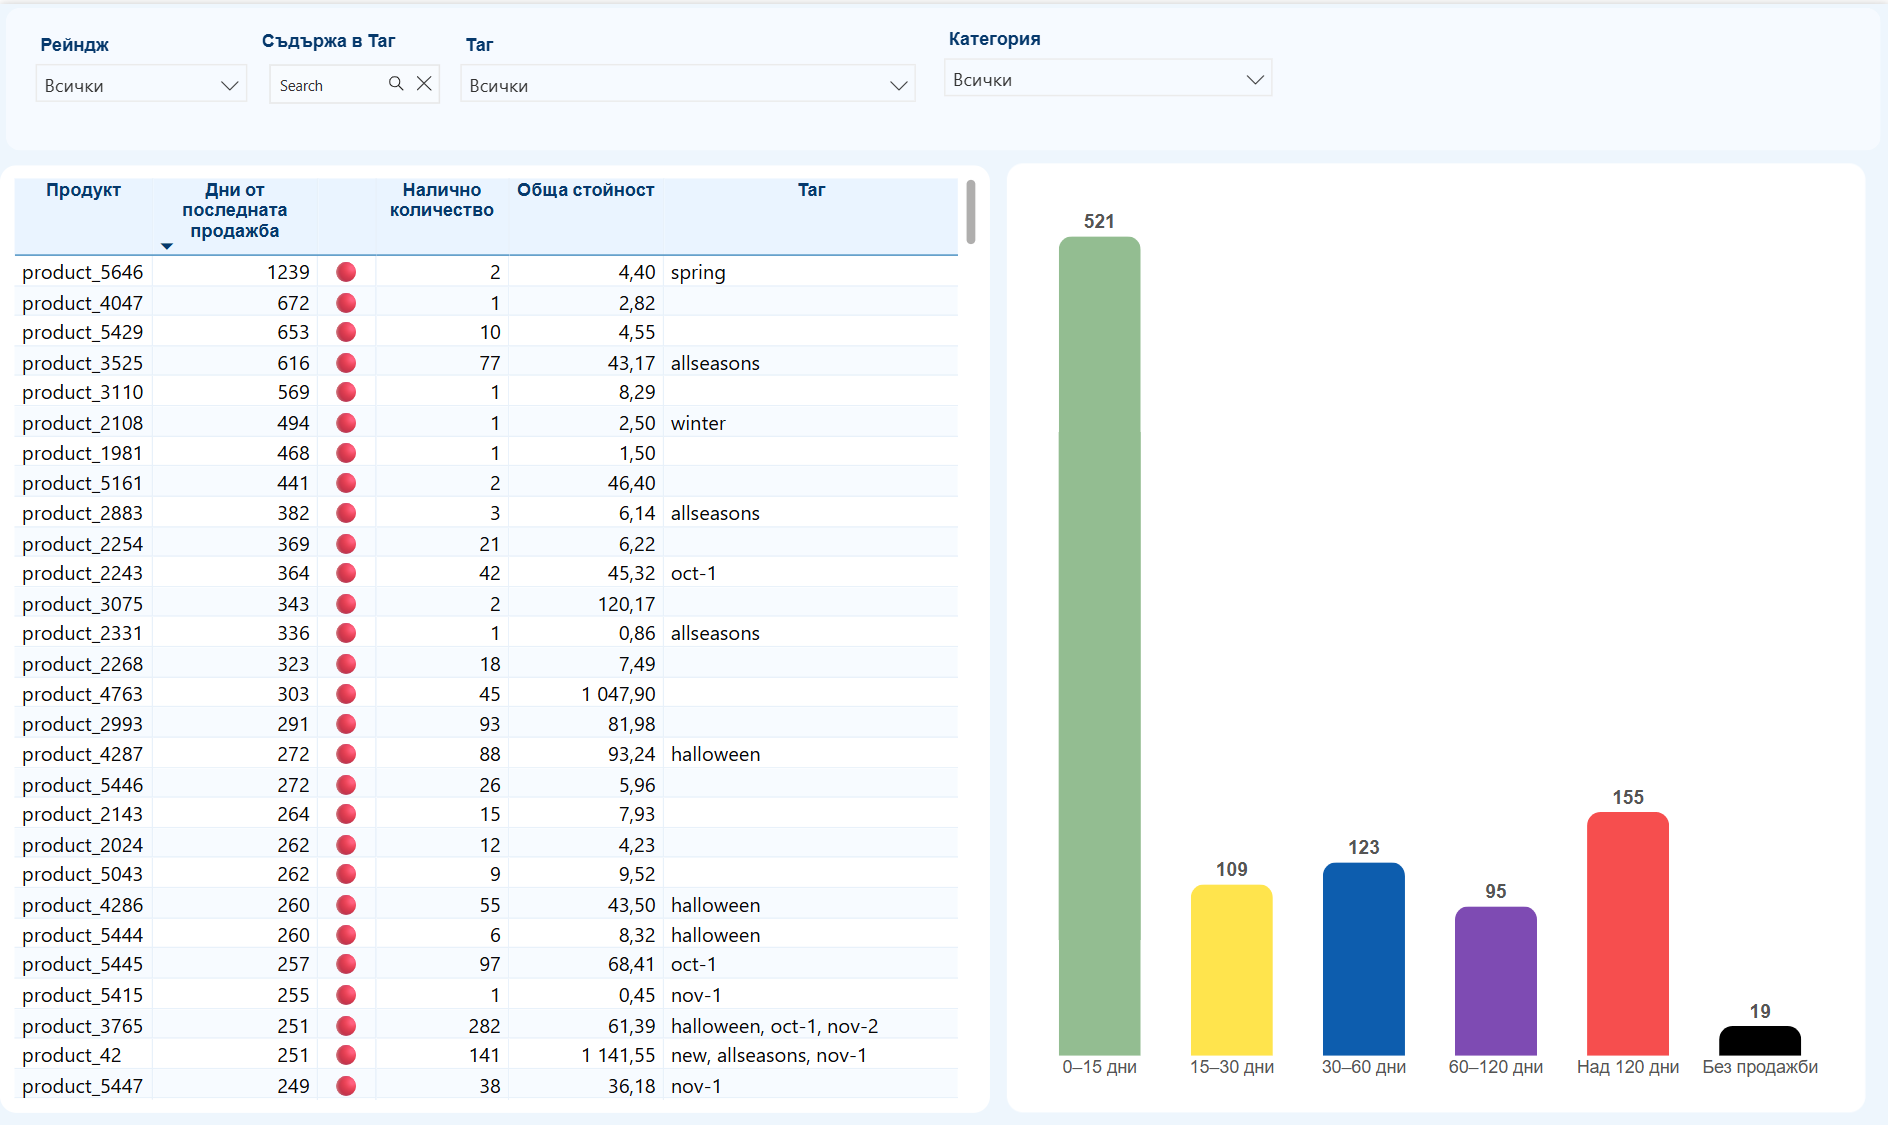
The Inventory Dashboard provides visibility into stock performance by showing available quantities, inventory value, seasonal tags and the number of days since each product’s last sale.
Products are categorized into aging groups (0–15, 15–30, 30–60, 60–120, and over 120 days), allowing businesses to identify slow-moving and obsolete inventory while measuring the amount of capital tied up in stock.
These insights support decisions related to discount campaigns, bundled offers, inventory clearance and reactivating advertising for slow-moving products. Purchasing and warehouse management teams can reduce overstocking, optimize warehouse capacity and improve cash flow.
The E-commerce Sales and Advertising Cost Analysis template is a standardized Business Intelligence solution that brings together sales, marketing, product and inventory data within a single reporting environment.
Through interactive dashboards and detailed analytics, organizations gain a complete understanding of their e-commerce performance, enabling data-driven decisions that optimize marketing investments, product portfolios, inventory management and operational processes.
The solution can be fully customized to meet the specific requirements of any online business and can be extended with additional KPIs, data sources and analytical reports as business needs evolve.
Interested in learning more? Contact the ITC Consult team to schedule a personalized demo>>